

Arthur Samuel says,
Machine Learning is a field of study that gives computers the ability to learn without being explicitly programmed.
If we want to talk about learning (Machine) then we would consider data. Cause, If a machine wants to learn then how can it is learned? Obviously, the answer is the different source of data. Today’s topic not about machine learning but it very close to this area. Now, I am going to talk about basic Statistics concept for machine learning. Let’s go to our cheat sheet for Statistics –
In statistics if you want to consider data then you have two options :
- Types of Data
- Level of Measurement
In statistics, we’ve mainly two types of data
- Categorical
- Numerical
Numerical data are two types –
- Discrete: Such as – SAT score, Children you want to have.
- Continuous: weight, height etc.
Now I am talking about some popular concept about statistics:
Mean: It’s the simple average of the datasets. Mind it, mean easily affected by outliers.
Equation:
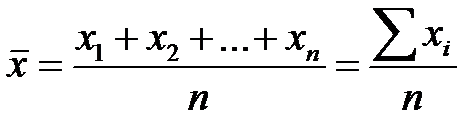
The mean is calculated by excel, = AVERAGE()
Median: The median is the midpoint of the orders datasets. In an ordered data set, the median is the number at position
Equation:

In Excel, = MEDIAN()
Mode: The mode is calculated simply by finding the value with the highest frequency.
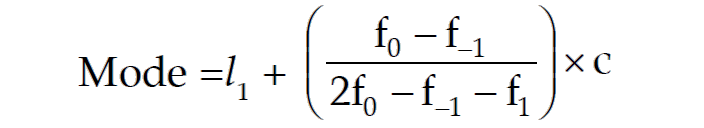
= MODE.SNGL() – Returns one mode
= MODE.MUL() – Returns an array with the modes. It’s used when we have more than 1 mode.
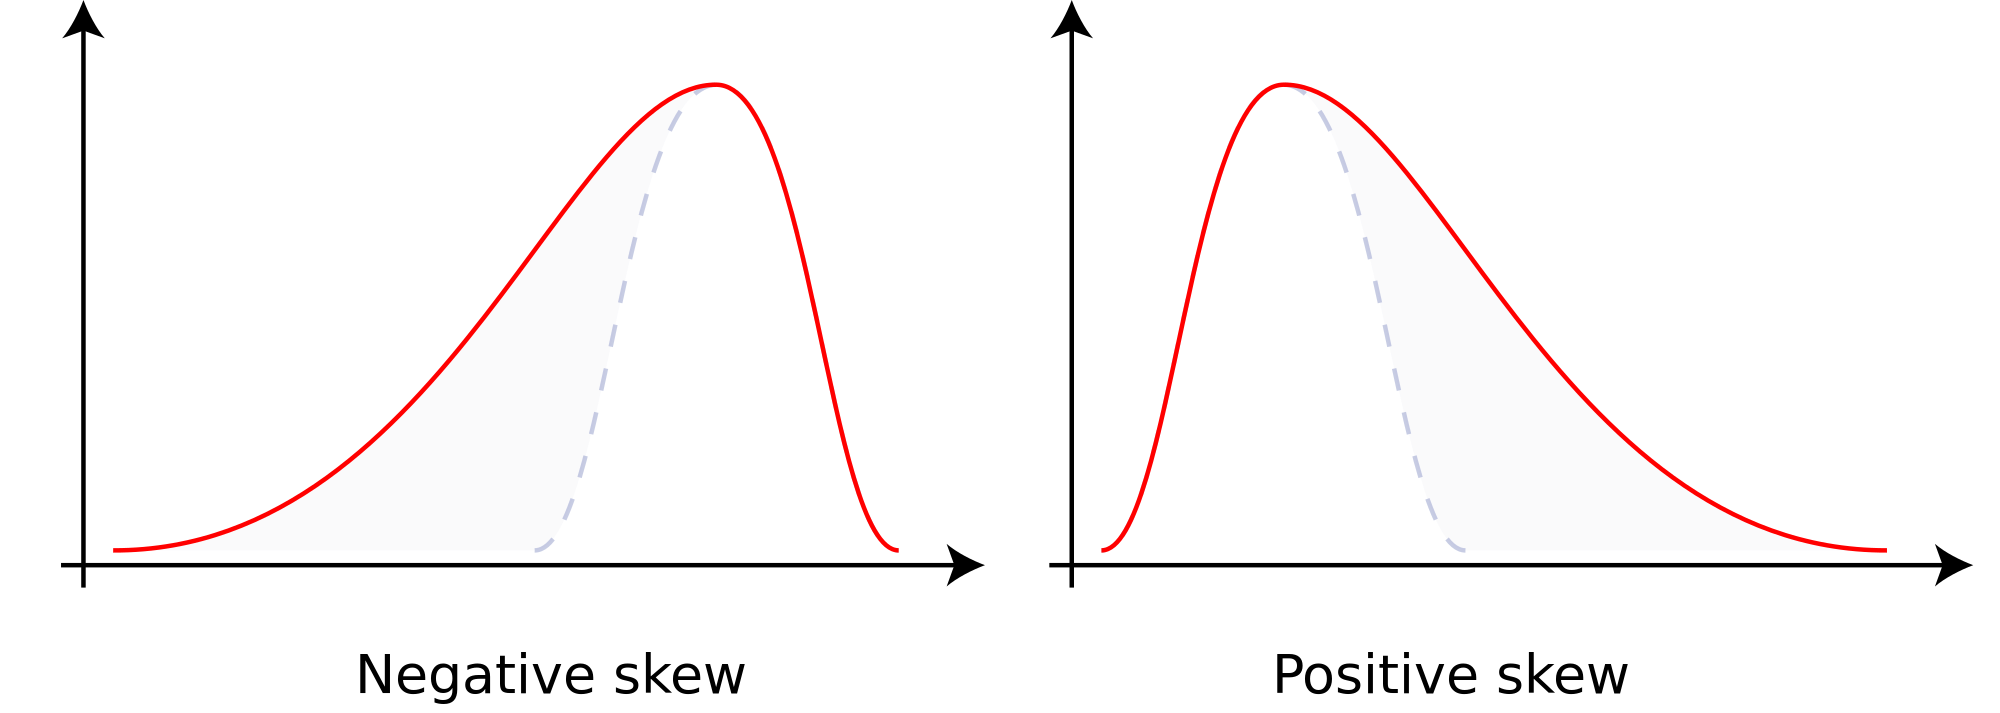
Skewness: Skewness is a measure of asymmetric that indicates whether the observation in datasets is concentrated on one side.
= SKEW() [The Skewness is calculated by]
Variance & Standard Deviation: Variance and SD measure the dispersion of a set of data points around its mean value.
(Sample is a subset of the population and population is a collection of all items of interest to this specific study) . In Excel,
Sample Variance = VAR.S()
Population Variance = VAR.P()
Sample SD = STDWV.S()
Population SD = STDEV.P()
Covariance: Covariance is a measure of the joint variability of two variables.
- A positive CV means that the two variables move together
- A covariance of 0 means that two variables are independent
- A negative covariance means that two variables move in opposite directions
In excel,
Sample CV = COVARIANCE.S()
Population CV = COVARIANCE.P()
Correlation: Correlation is a measure of the joint variability of two variables.
- A correlation of 1, known as perfect positive correlation means that one variable is perfectly explained by other
- A correlation of 0 means, that the variables are independent.
- -1, known as perfect negative correlation, means that they’re explaining others but move in opposite directions.

In excel, calculated by
= CORREL()
Written By,
Raju Ahmed Rony
Machine Learning Enthusiast
Manager, Idea & Innovation, Youth Carnival
Dept. of Software Engineering
Daffodil International University
LinkedIn: https://www.linkedin.com/in/rarony/